WordPress Speed Optimization: Find the Real Bottleneck First
Some links on this page are affiliate links. If you buy through them, we may earn a commission at no extra cost to you. It never decides what we recommend —read how we make money.
“My WordPress site is slow” is four different problems wearing the same coat. The server can be slow to answer. The page can be quick to answer but slow to show anything. It can show up fast and then ignore your clicks. Or it can look finished and keep moving things around while you read.
Each of those has different causes and different fixes, and the fix for one does nothing for the others. Compressing images won’t help a site that’s slow because every request waits on PHP. A faster server won’t help a page that’s blocked by 800 KB of JavaScript from a slider.
So this guide works in the order a developer would: measure, identify which kind of slow you have, fix that layer, measure again.
The Four Layers of a Slow Page
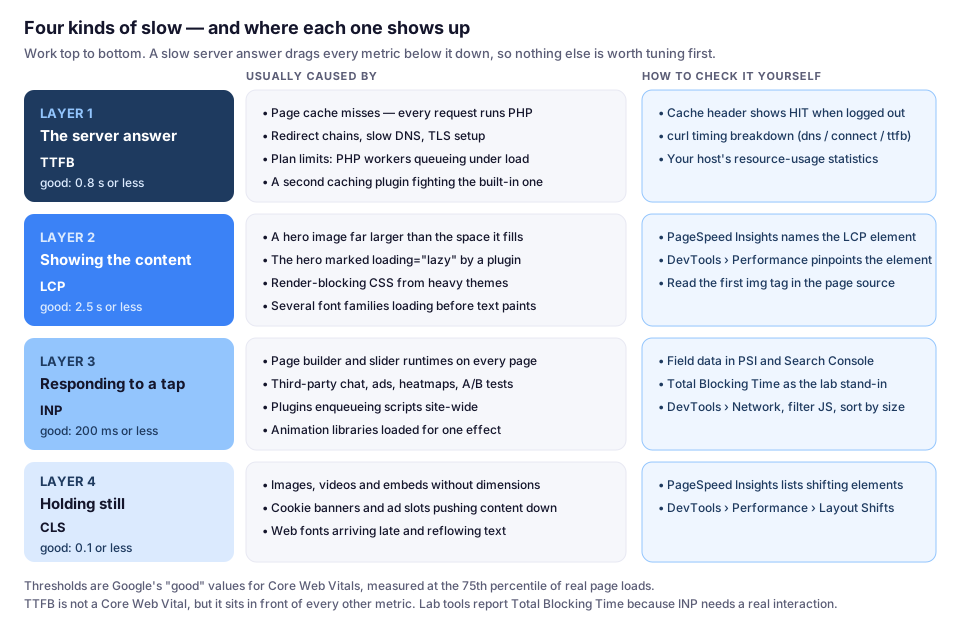
Work down the list. A page that answers slowly is slow for everyone, on every metric, so the server layer comes first. Once the answer is quick, the rest is about what you’re sending to the browser.
Step 1: Measure, and Know Which Number You’re Looking At
Run your homepage and one typical post through PageSpeed Insights (pagespeed.web.dev). It shows two things that get confused constantly:
- Field data — “Discover what your real users are experiencing” — comes from the Chrome User Experience Report: real visits over the past 28 days. This is what Google’s Core Web Vitals assessment uses. New or low-traffic pages often don’t have enough visits to show it.
- Lab data — “Diagnose performance issues” — is one simulated load on a throttled mobile device. It’s how you find causes, but the score moves between runs. Don’t chase single points.
Once the site has traffic, Search Console’s Core Web Vitals report shows the same field data across all your pages, grouped by problem, so you can see whether one template is dragging down a whole section. Our guide to connecting Search Console and Analytics covers the setup.
The Three Metrics, and What They Mean on a WordPress Site
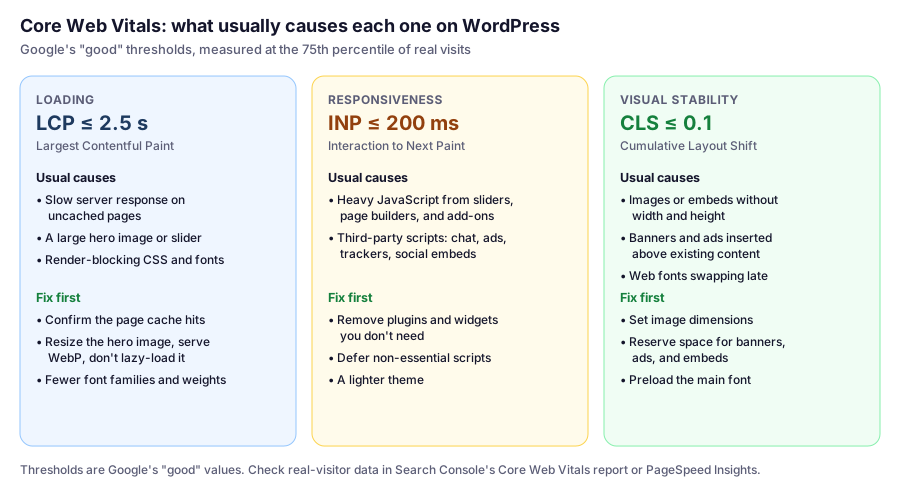
Google’s published thresholds for “good” are LCP of 2.5 s or less, INP of 200 ms or less, and CLS of 0.1 or less, measured at the 75th percentile of page loads and split between mobile and desktop. A page passes when all three hit that mark.
Two details worth knowing:
- INP replaced First Input Delay as a stable Core Web Vital in 2024. If you’re reading older advice about FID, it’s describing a metric Google no longer uses.
- Lab tools can’t measure INP, because nobody is clicking. Lighthouse reports Total Blocking Time (TBT) instead, which stands in for INP in the lab: improving TBT usually improves INP in the field.
Measuring the Server Layer Yourself
TTFB isn’t a Core Web Vital, but it sits in front of everything else. As a rule of thumb, 0.8 s or less is good, and over 1.8 s is poor. It’s the sum of redirects, DNS lookup, connection and TLS negotiation, and the wait for your server to produce the first byte.
You don’t need a tool for it. This prints the breakdown for any URL:
curl -o /dev/null -s -w "dns: %{time_namelookup}s connect: %{time_connect}s tls: %{time_appconnect}s ttfb: %{time_starttransfer}s total: %{time_total}s\n" https://yourdomain.com/Run it a few times. What you’re looking for:
- TTFB well under a second and stable — the server layer is fine, move down the list.
- TTFB fine on the second run, awful on the first — you’re seeing cache misses. The fix is in caching, not hardware.
- A large gap between
connectandttfb— the wait is PHP and the database building the page. dnsin the hundreds of milliseconds — that’s your DNS provider, not your host.
Step 2: Make the Server Answer Fast
Confirm the Page Cache Is Actually Hitting
A cached page is returned without running PHP or touching the database, which is why this is the single biggest lever on shared hosting. Every managed host sets a response header telling you whether it worked:
| Host | Header to check | What “served from cache” looks like |
|---|---|---|
| SiteGround | x-proxy-cache |
HIT (see our SiteGround review for MISS and BYPASS) |
| Hostinger, ChemiCloud | x-litespeed-cache |
hit (see our Hostinger review) |
| ScalaHosting | x-litespeed-cache |
hit when you run OpenLiteSpeed or LiteSpeed Enterprise |
curl -sI https://yourdomain.com/ | grep -i cachePublic pages should be HIT on the second request. If they’re never cached, stop optimizing images and fix that first — nothing else you do will matter as much.
Two things commonly break it: a second caching plugin fighting your host’s built-in cache, and a plugin that sets no-cache headers site-wide (some cookie banners, membership and currency-switcher plugins do this). Pick one caching layer and remove the rest.
Add an Object Cache for the Pages That Can’t Be Cached
Carts, checkout, logged-in views and search results are built fresh every time by design. An object cache (Memcached or Redis) keeps the results of repeated database queries in memory so those pages don’t rebuild everything from scratch.
Availability differs by host and plan: SiteGround offers Memcached on its shared plans, Hostinger includes object caching on Unlimited and above, and ChemiCloud exposes Redis through cPanel’s AccelerateWP. Each host’s review has the specifics.
The Boring Server Wins
- Run a current PHP version. Newer branches are faster and still receiving security fixes; your host’s panel lets you switch, and our WordPress requirements guide covers what WordPress itself asks for.
- Kill redirect chains.
http://tohttps://towww.to the final URL costs a round trip each time. Point your links and canonical host at the final URL. - Watch wp-cron on busy sites. WordPress fires scheduled tasks on page loads by default. On a site with real traffic, disabling that and running a real system cron moves the work off visitors’ requests.
- Keep the options table lean. Options marked to autoload are loaded on every request. In phpMyAdmin:
SELECT ROUND(SUM(LENGTH(option_value)) / 1024) AS autoloaded_kb
FROM wp_options WHERE autoload NOT IN ('no', 'off');
A few hundred KB here usually means an abandoned plugin left data behind. (Recent WordPress versions use more than one value in the autoload column, which is why the query excludes the “off” values instead of matching “yes”.)
When It’s the Plan, Not the Setup
Shared plans meter CPU, memory and concurrent PHP processes. If cached pages are fast but uncached ones queue up under load — a store at checkout, a membership site, a forum — you’ve hit the plan’s ceiling rather than a configuration mistake. Our guide to shared hosting vs. VPS shows how to read your account’s resource stats and when the upgrade is the right call.
Step 3: Fix LCP (The Main Content Showing Up)
LCP is almost always the hero image, the first image in a post, or a large block of heading text. PageSpeed Insights names the element; DevTools’ Performance panel marks it on the timeline.
Size the image for the slot it fills. A 4000-pixel photo displayed 800 pixels wide is wasted bandwidth even after compression. Export near the display size, let WordPress generate the smaller variants, and serve WebP.
Never lazy-load the hero. Lazy-loading tells the browser it can wait — exactly the wrong instruction for the element LCP measures. WordPress core handles this automatically: it decides per image whether to add loading="lazy", fetchpriority="high" or decoding="async", and it deliberately never puts loading="lazy" and fetchpriority="high" on the same element. Problems appear when a plugin overrides that logic and lazy-loads everything. Check the markup you actually ship:
curl -s https://yourdomain.com/ | grep -o "<img[^>]*>" | head -5If the first image carries loading="lazy", find the plugin setting that excludes above-the-fold images and use it.
Get fonts out of the critical path. Every custom family and weight is another file the browser wants before it paints text. Two or three files is usually plenty. Self-hosting them removes a third-party connection — and for EU visitors it also avoids sending their IP address to a font CDN.
Reduce render-blocking CSS. Page builders and multipurpose themes load stylesheets for features the page never uses. Which is why the cheapest LCP win on a new site is a lean theme: GeneratePress starts with a fraction of the CSS and JavaScript that feature-packed themes ship, leaving room for what you actually add.
Step 4: Fix INP (The Page Responding to You)
INP measures the delay between a real interaction — tap, click, key press — and the next frame the browser paints. Bad INP means JavaScript is busy when the visitor acts.
Find out what you’re loading. In DevTools, open Network, filter to JS, reload, and sort by size. The usual offenders:
- Page builders and slider plugins, which ship their own runtime on every page.
- Third-party scripts: chat widgets, ad tags, heatmaps, A/B testing, social embeds. These run on someone else’s server and their weight changes without telling you.
- Plugins that enqueue globally, loading a contact-form or gallery script on all 400 pages because it’s needed on two.
What actually helps, in order of payoff:
- Remove what you don’t use. Deactivating a slider plugin removes its JavaScript everywhere. No setting beats not loading the code.
- Load third-party scripts late. Chat and analytics rarely need to run before the page is interactive.
- Limit plugins to the pages that need them. Some optimization plugins can dequeue assets per page; otherwise check whether the plugin has its own “load only where used” setting.
- Prefer blocks over builder layouts for simple pages. A page built with core blocks ships no builder runtime at all.
Watch TBT in the lab while you do this. It’s the number that moves before field INP catches up.
Step 5: Fix CLS (The Page Holding Still)
CLS is the cheapest to fix and the most annoying to visitors — the tap that lands on the wrong link because a banner pushed the layout down.
- Give every image, video and embed explicit dimensions so the browser reserves the space before the file arrives.
- Reserve space for anything injected: cookie banners, notification bars, ad slots, “related posts” widgets. Fixed-height containers, not content that appears from nowhere.
- Use
font-display: swapand preload the main font so text doesn’t reflow when the font lands.
The Optimization Plugin: Turn Things On in a Safe Order
Your host’s optimization plugin — SiteGround’s Speed Optimizer, LiteSpeed Cache on Hostinger and ChemiCloud — groups its settings by what they touch. The groups do not carry the same risk:
| Order | Setting group | What it does | Risk |
|---|---|---|---|
| 1 | Media: compression, WebP, lazy loading | Smaller images, offscreen images load later | Low |
| 2 | Minify CSS and JavaScript | Strips whitespace and comments | Low to medium |
| 3 | Font optimization and preloading | Changes how fonts load | Medium — check headings still render right |
| 4 | Combine CSS/JS, defer render-blocking JavaScript | Changes file order and grouping | Higher — breaks sliders, menus, forms, checkout |
Enable one group, clear the cache, then check the homepage, a post, the mobile menu, a form, and checkout if you have one. Only then move on. If your plan includes staging, try group 4 there first. When something breaks, turn the last setting off and use the plugin’s exclusion list for the specific script rather than abandoning the whole group.
Four Situations, Four Different Fixes
A new blog on shared hosting scoring 45 on mobile. Field data is empty because traffic is low, so you’re working from lab data. The likely causes: an uncached homepage and a multi-megabyte header image straight from a stock library. Confirm the cache header hits, re-export the hero at display size, enable the media group of the optimization plugin, and re-run. That’s an hour of work and usually the biggest single jump the site will ever see.
A small business site built with a page builder: LCP fine, INP failing. The server isn’t the problem and a bigger plan won’t help. Audit the JavaScript: the builder’s runtime, an animation library, a chat widget, a maps embed. Remove the widgets nobody uses, delay chat until after load, and rebuild the two or three simple pages (contact, about) with core blocks.
A WooCommerce store that’s fast to browse and slow to buy. Product and category pages are cached; cart, checkout and account pages are excluded on purpose, so they run PHP every time. Object caching helps, but if checkout queues up during promotions you’re competing for the plan’s PHP workers — the point where our shared hosting vs. VPS comparison and the managed options in our best VPS hosting guide become relevant.
A site whose visitors are on another continent. Cached pages still travel the distance. A CDN serves static files — and on some hosts whole pages — from locations near the visitor. It’s included on most managed plans; turning it on is the whole job.
“Should I Buy a Speed Optimization Service?”
Most WordPress speed services do a version of this list: turn on caching properly, compress and resize images, remove duplicated optimization plugins, cut unused scripts, and hand back a before-and-after PageSpeed report. That’s genuinely useful if you don’t want to learn it — but two things are worth knowing before you pay.
First, nobody can optimize away the plan you’re on. If uncached requests queue because you’re at your CPU ceiling, the fix is a bigger plan or a leaner site, not a service.
Second, ask what happens afterwards. A one-off pass degrades as you add plugins and images. Ask whether they’ll remove plugins (the fix that lasts) or only defer them, and whether you’ll be able to keep the setup running yourself.
Keep an Honest Record
Field data covers a rolling 28 days, so a real improvement takes up to four weeks to fully appear in PageSpeed Insights and Search Console. Lab data reacts immediately. Write both down before you change anything:
| Page | Failing metric | Change made | Before | After |
|---|---|---|---|---|
| Homepage | LCP (lab) | Resized hero, WebP, removed lazy-load | your number | your number |
| Product page | INP (field) | Removed chat widget | your number | your number |
One change at a time. Two changes and a better score tell you nothing about which one worked — or which one is quietly breaking checkout.
FAQ
Why is my WordPress site slow?
Usually one of four things: pages aren't being served from cache so every request runs PHP, the largest image loads late, JavaScript from page builders and third-party widgets blocks interaction, or elements shift as the page loads. Measure first — PageSpeed Insights names which of these applies, and the fix for one does nothing for the others.
What are good Core Web Vitals scores?
Google's thresholds for good are Largest Contentful Paint of 2.5 seconds or less, Interaction to Next Paint of 200 milliseconds or less, and Cumulative Layout Shift of 0.1 or less, measured at the 75th percentile of real page loads and split between mobile and desktop.
Why does my PageSpeed Insights score change every time I run it?
The performance score comes from lab data: one simulated load whose result varies with network and server conditions. Compare several runs rather than one, and use the field data section, which reflects real visits over the past 28 days, to judge whether users actually experience the site as fast.
How do I check whether my host's caching is working?
Open the page logged out and look at the response headers. SiteGround sets x-proxy-cache and LiteSpeed hosts such as Hostinger and ChemiCloud set x-litespeed-cache; a hit means the page came from cache. From a terminal, curl -sI https://yourdomain.com/ | grep -i cache shows the same thing.
Do I need a caching plugin if my host already caches pages?
No, and running both usually causes problems. Managed hosts pair their server-level cache with their own plugin — Speed Optimizer on SiteGround, LiteSpeed Cache on LiteSpeed hosts. Adding a second caching plugin on top tends to produce stale or half-broken pages rather than extra speed.
Does site speed affect Google rankings?
Core Web Vitals are part of Google's page experience signals, but Google is clear that relevant, helpful content matters more. Treat speed as something that helps when competing pages are similarly useful — and that always helps visitors, regardless of ranking.
Will a faster hosting plan fix a slow site?
Only if the server is the bottleneck. If cached pages already return quickly and the site still feels slow in a browser, the weight is in the front end — images, scripts, fonts and third-party widgets — and a bigger plan downloads none of that any faster.
How long until improvements show up in Search Console?
Field data in both PageSpeed Insights and Search Console covers a rolling 28-day window, so a fix takes up to four weeks to be fully reflected. Lab measurements show the effect immediately, which is why it's worth recording both.
What to Do Next
Speed is one half of the page experience story. The other half is whether search engines can find, index and understand the page at all — our WordPress SEO checklist covers that side, and our comparison of SEO plugins covers the plugin that produces the technical output.
If your measurements pointed at the server rather than the page, start with how to choose WordPress hosting and the resource limits explained in shared hosting vs. VPS.